Data Scientist Dashboard
NOTE: The following examples use test (or dummy) data, so no sensitive data is being exposed in these examples.
While working at Kemper, I was asked to create a dashboard application that the data science team could use to present their findings to executives. A data scientist could create a dashboard, add data sources to their dashboard, create tables and charts, publish the dashboard, and share the published link with anyone inside the company.
I was the sole developer on this project, which was created with a Python backend (using FastAPI), a SvelteKit frontend, and a Postgres database. It ran inside Docker containers for local development and Kubernetes in the production environment.
These are some of the features in this app:
View, Edit, Delete, Or Create New Dashboards
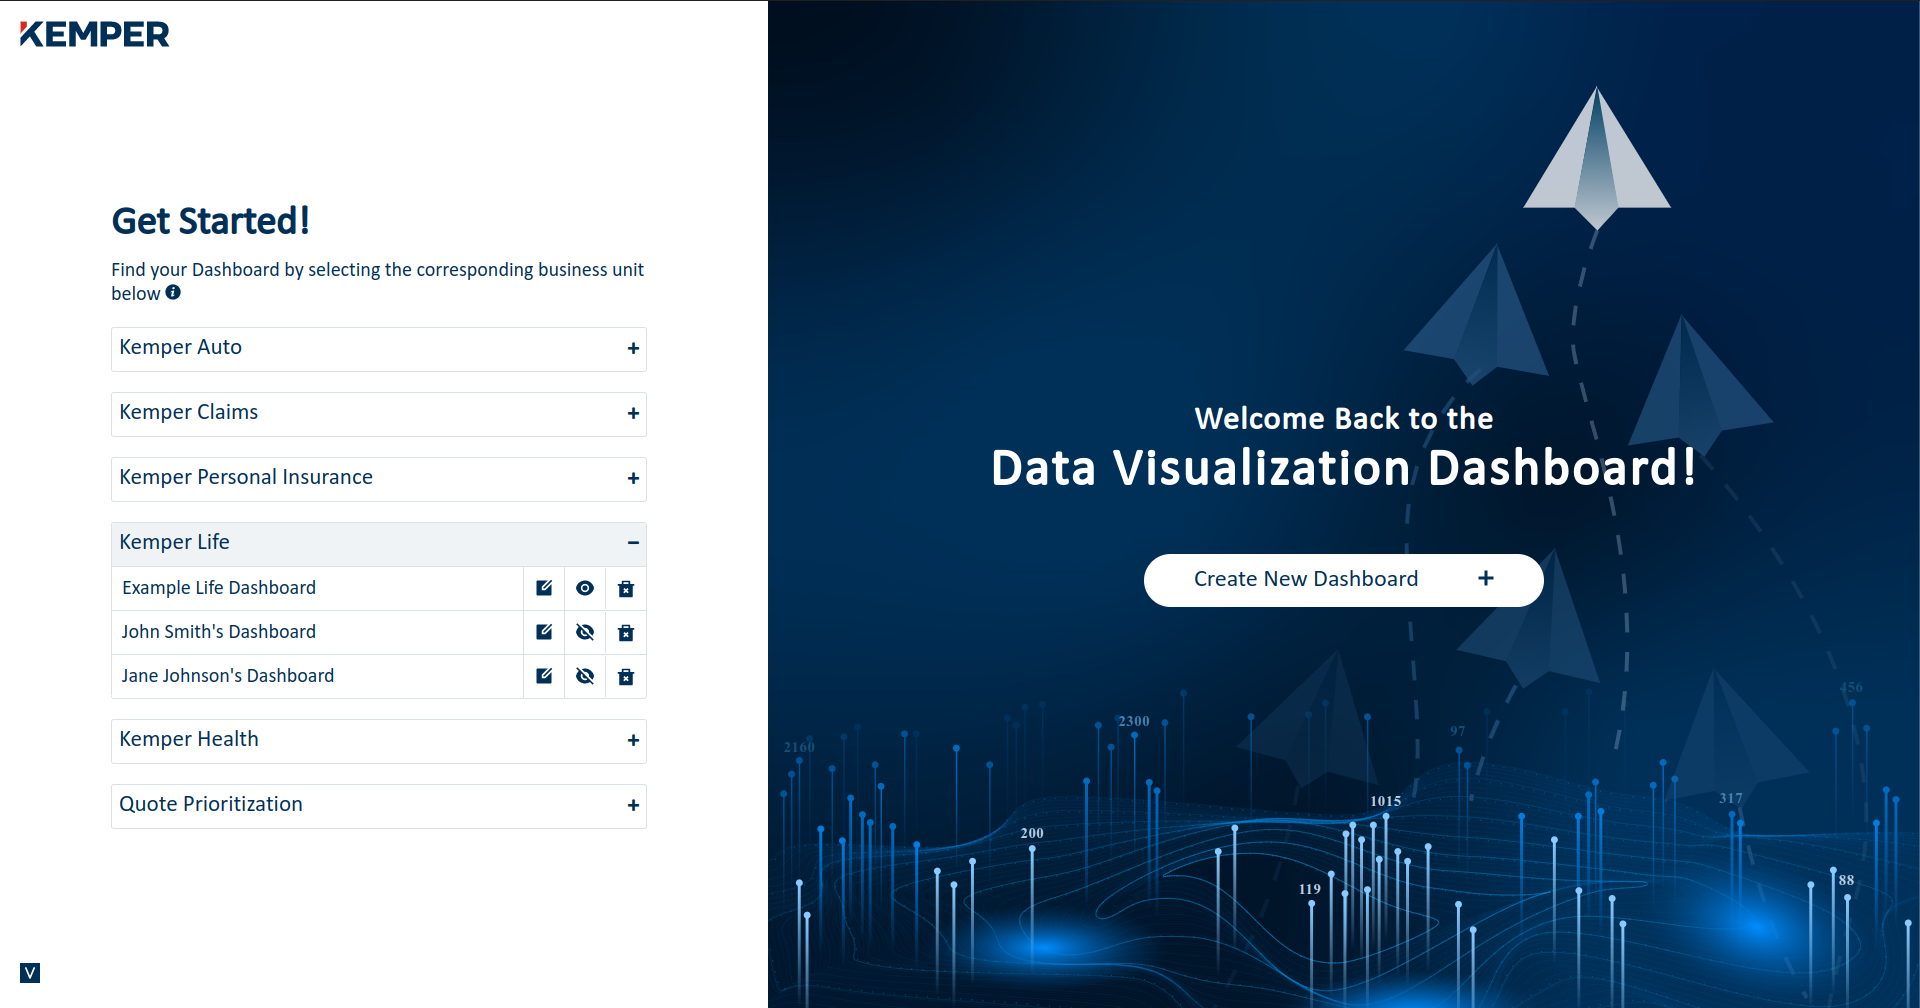
The dashboards were organized by business unit. Data scientists could create as many dashboards as they wanted.
Add Data Sources
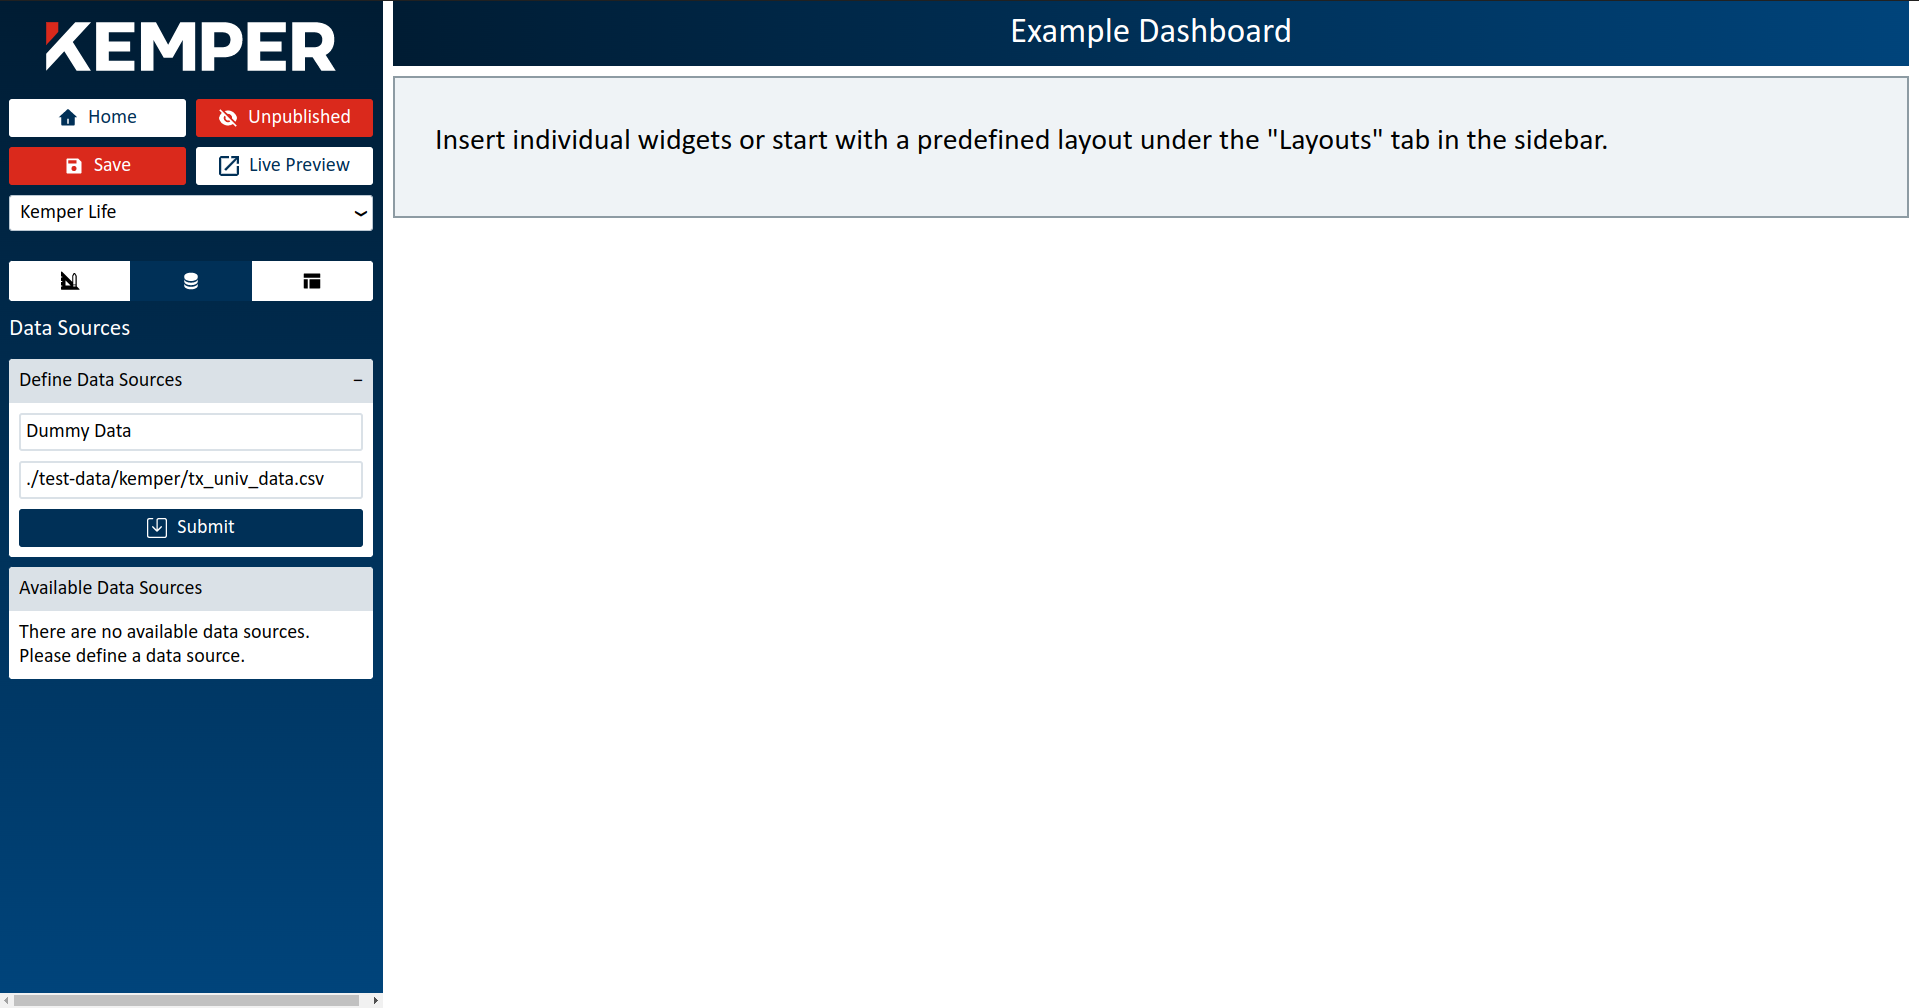
To create data sources for a dashboard, data scientists would copy and paste the file path of a data file (e.g. a CSV file) that was stored in S3. The data sources in each dashboard were only available in that specific dashboard. In other words, no one could access another person's data sources.
Insert Widgets
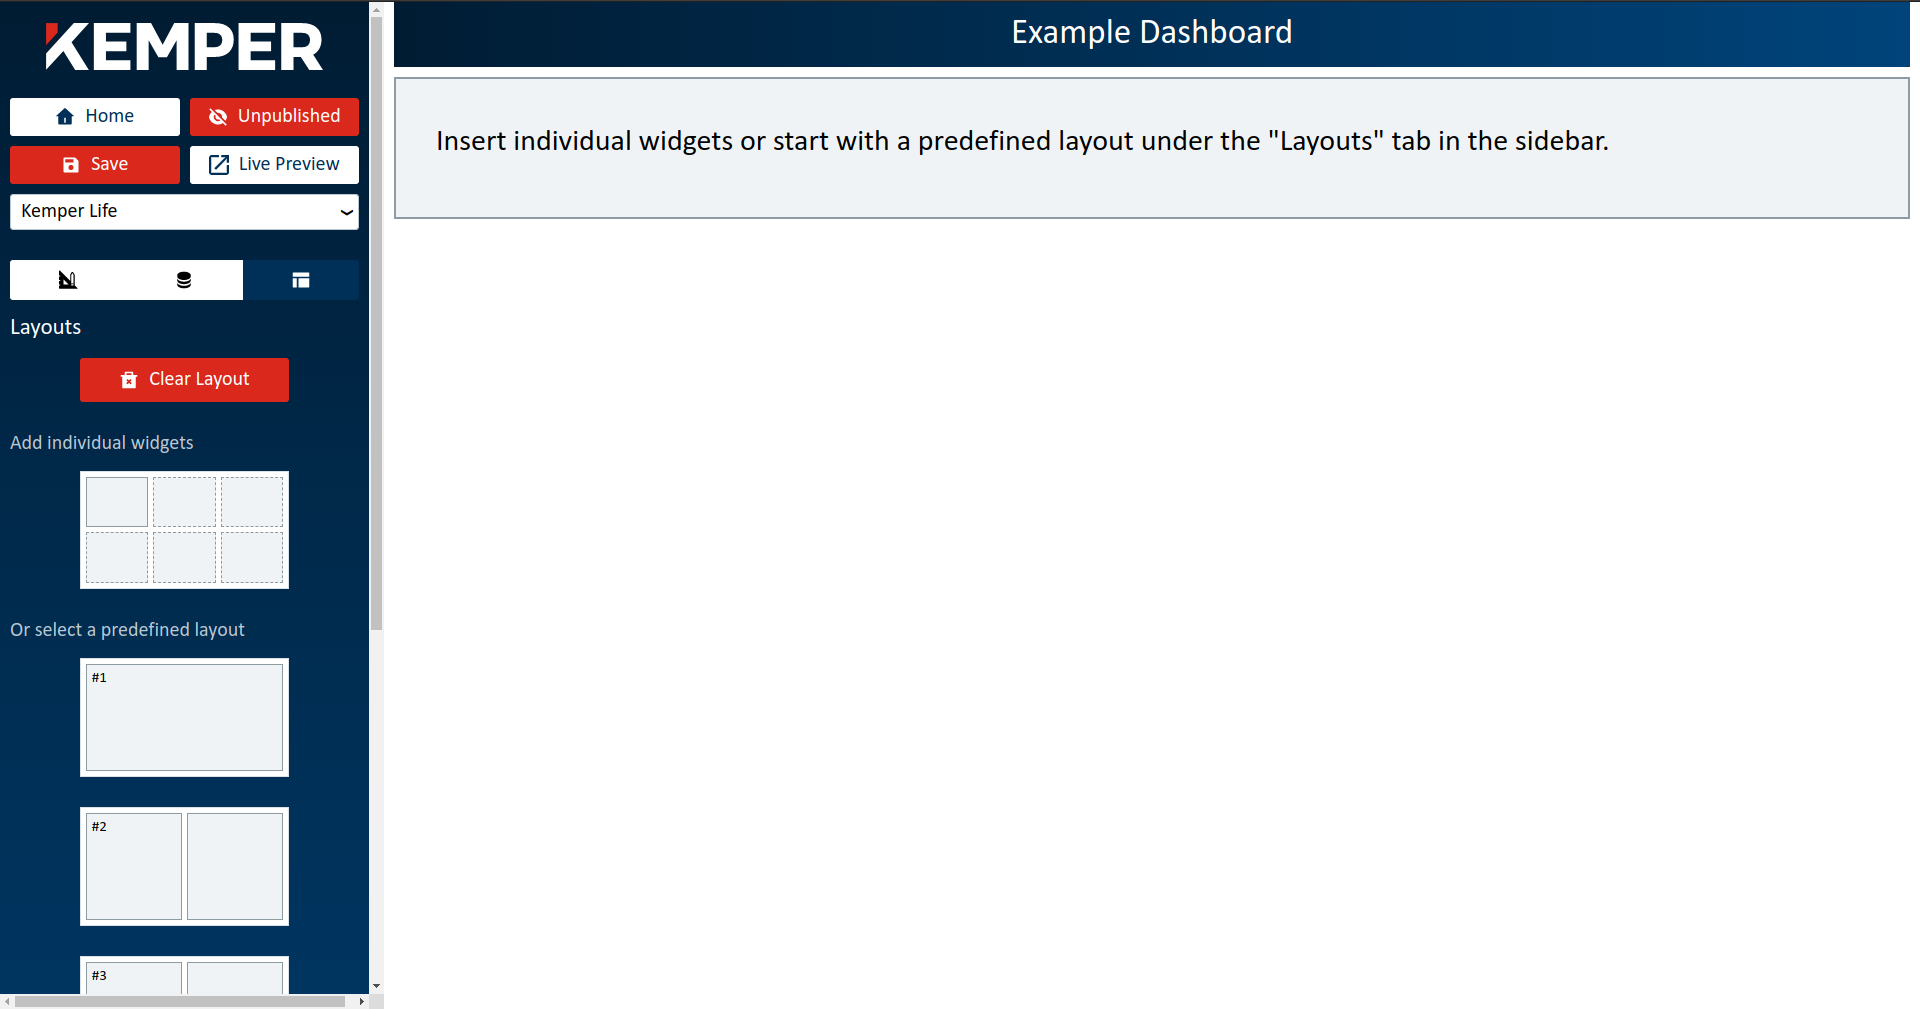
Data scientists could insert widgets and then create either a data table or a chart inside each widget. Data scientists had the option of inserting individual widgets or a predefined layout that filled the entire dashboard.
Create Chart Widgets
When data scientists selected the chart widget they could attach a data source to the chart and then define the chart parameters, including axes and the data that would populate the chart. End users could filter the data that was displayed in the chart from a dropdown menu located at the bottom of the chart.
Create Table Widgets
When data scientists selected the table widget they could attach a data source to the table and a table would get created with the data. The table widgets were not necessarily used in a final dashboard. They were often used to inspect the data in the dataset as data scientists were creating their charts.
Live Preview
Data scientists could click the "Live Preview" button to see how their finished dashboard would look to an executive or another stake holder after it was published.