Real-time Data Dashboard
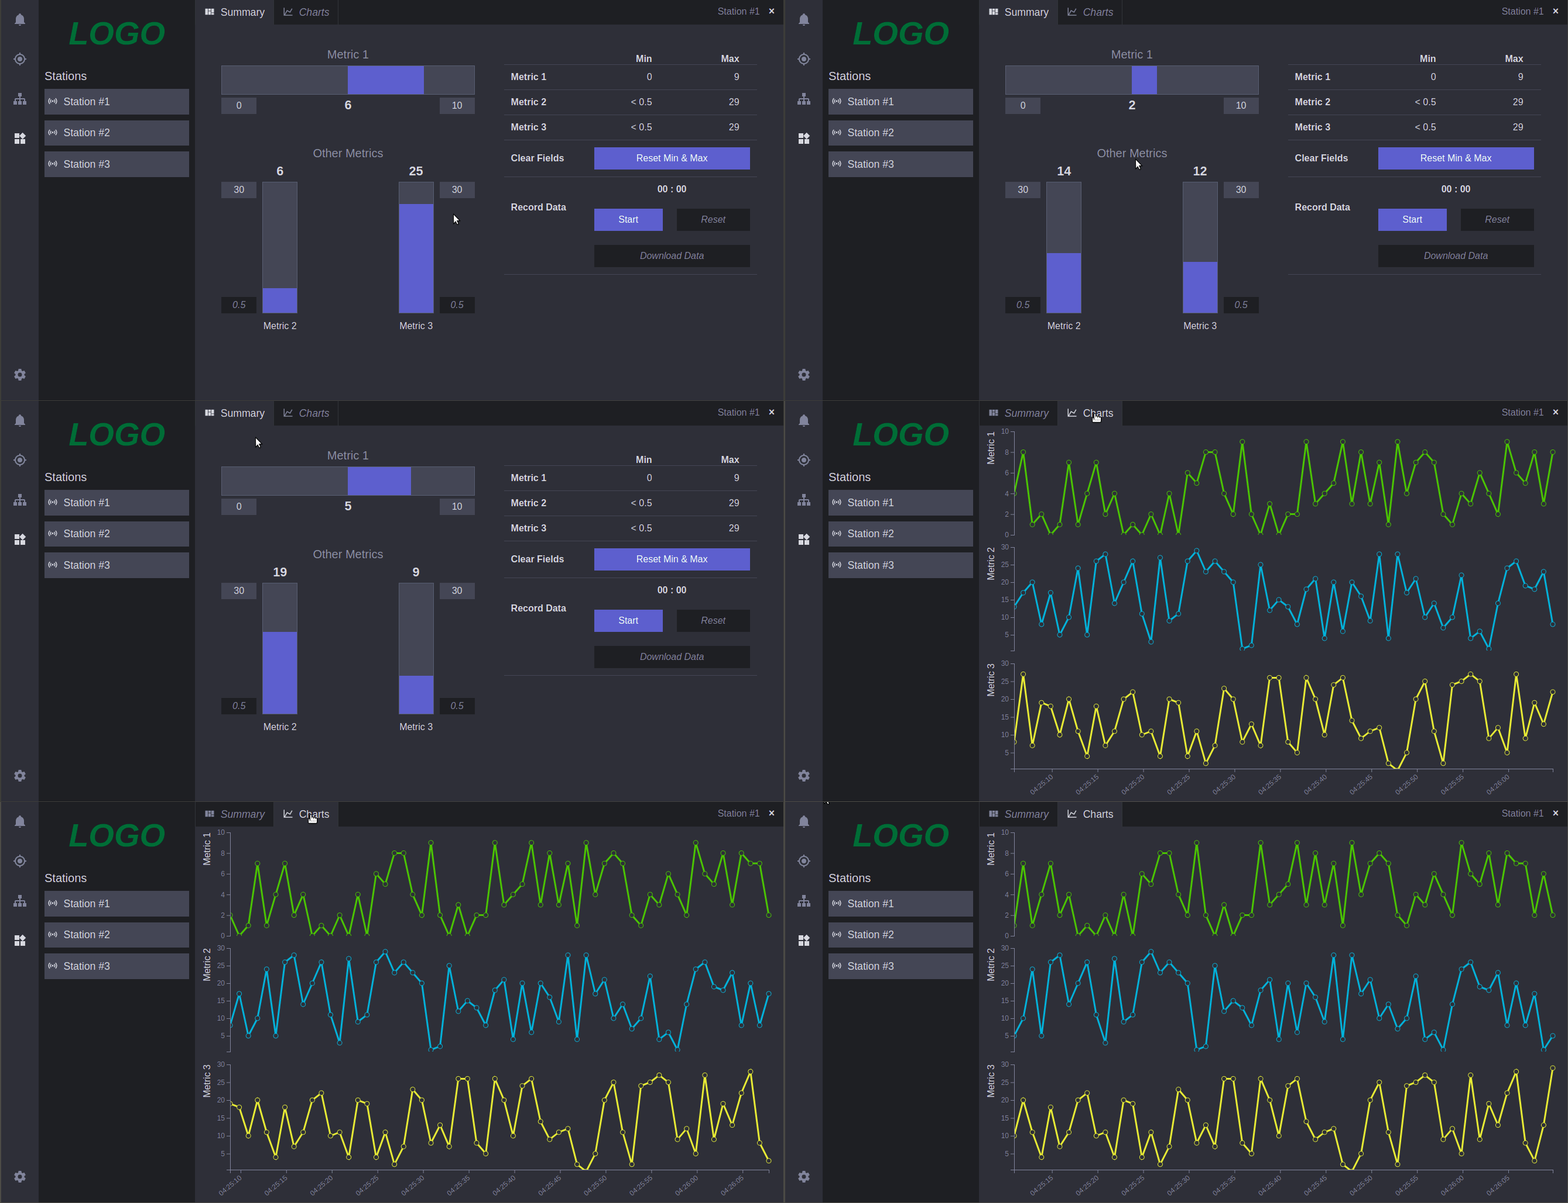
I did some work for a large manufacturing company that needed a second-by-second data dashboard. This app provides real-time status updates on various stations and equipment throughout the manufacturing facility. The front-end is a single-page application (SPA) written with Vue.js, Vue Router, and Vuex. All the UI components are custom made and the entire app (including the navigation and all the various windows) is completely mobile-responsive.
These are some of the features in this app:
Real-time Data Via WebSockets

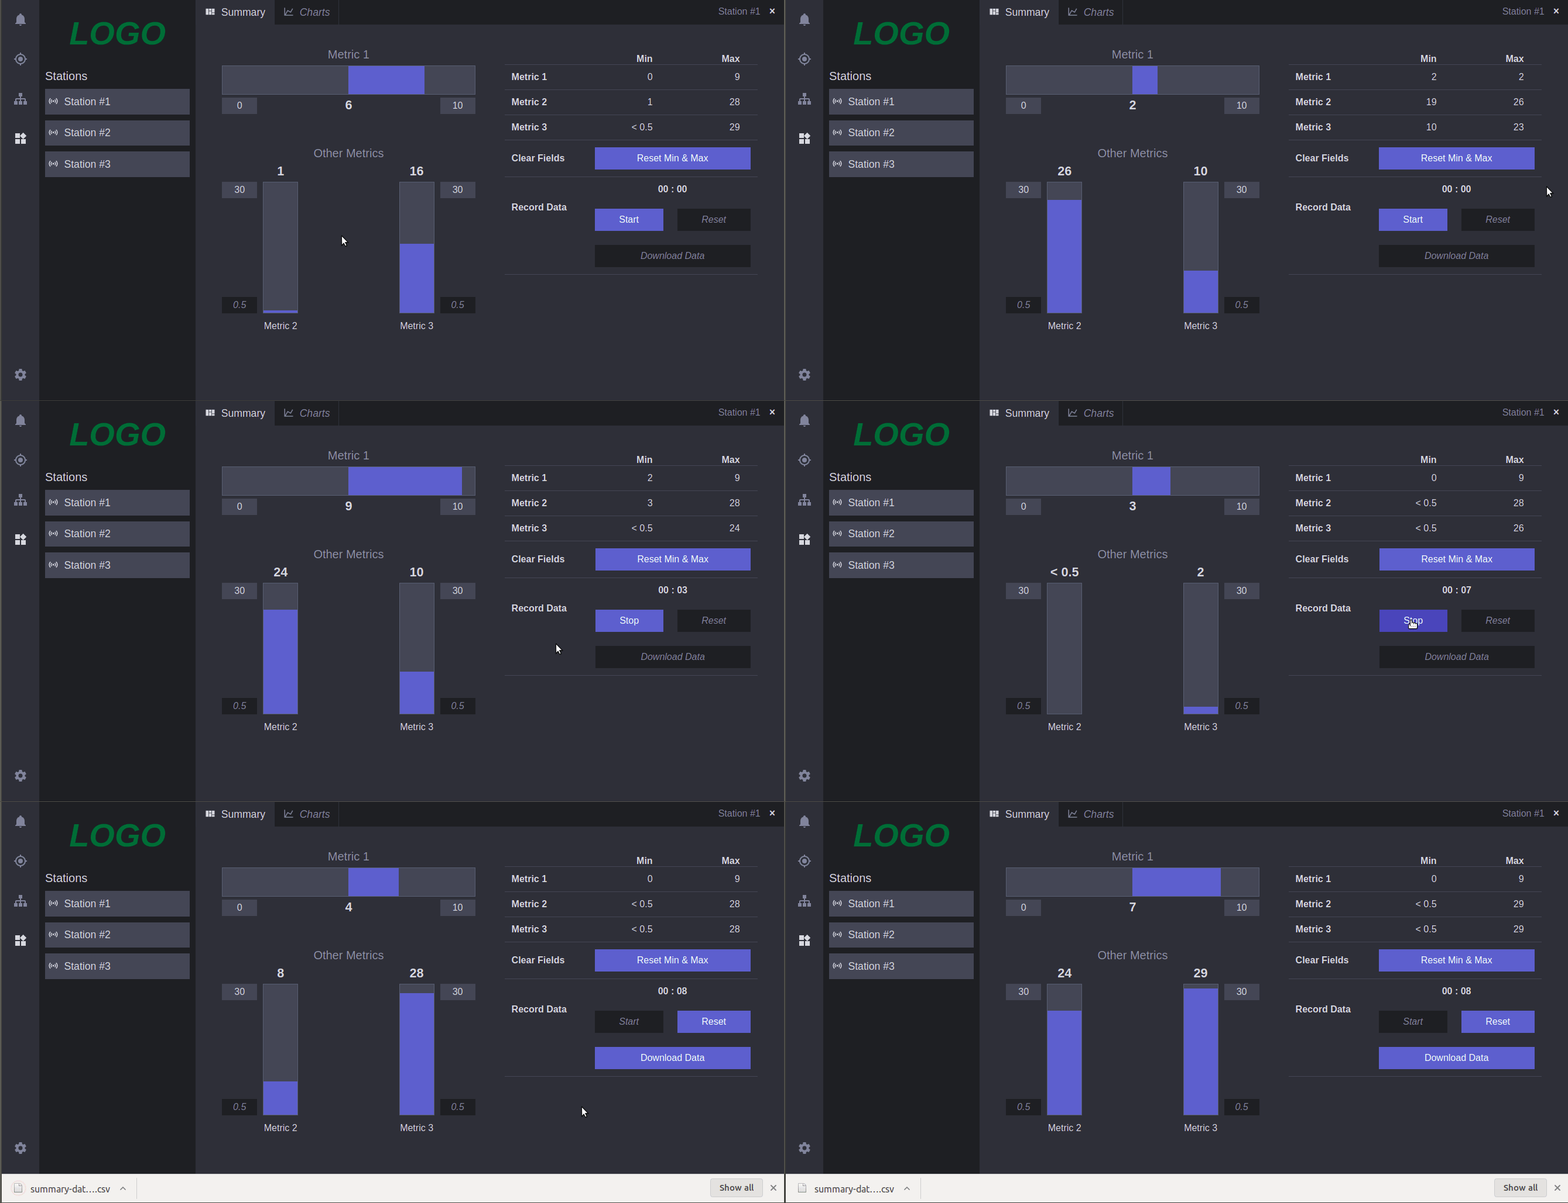
The data from the back-end is fed to the UI and inserted into a real-time dashboard that includes summary data and live charts.
Interactive Charts With D3.js

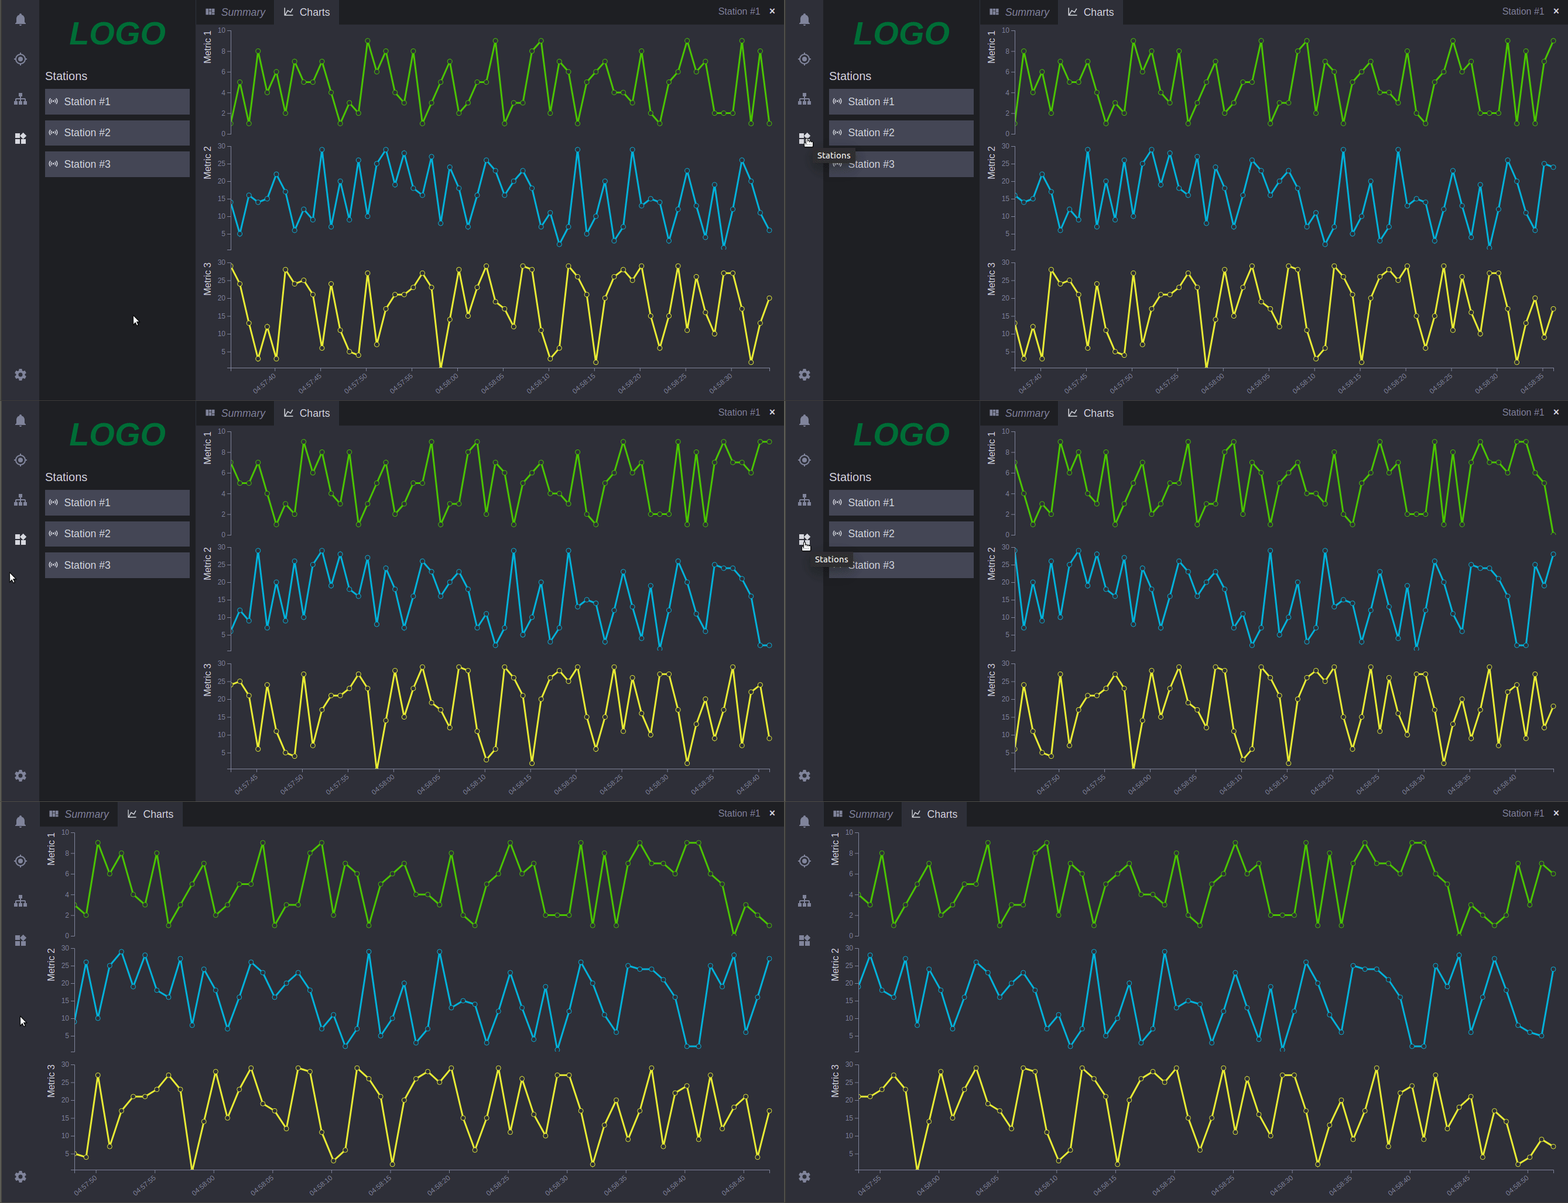
These charts were custom created using D3.js. Users can change the data ranges that they want displayed for each chart. Also, when a user hovers over a data point, the data for that specific point is displayed.
Record and Download Data

Users can record data and download the recorded data as a CSV file for further analysis. The downloaded CSV file is saved to the user's computer. The data recording and downloading feature is completely implemented in the browser.
Collapsible Side Panel With Auto-adjusting Charts

This feature allows users to get a larger view of the charts for a more detailed view on small devices. The real magic is that the charts have a function that watches changes in the available space and they will auto-adjust their size to fit the available space.
NOTE: I wrote the original back-end server in Node.js with MongoDB and WebSockets. However, after working on the project for a while, our team realized that Go would be a better fit for what we needed.